
waves are affected by Period
At Surf With Amigas Retreats we consistently hear the same remarks… “The surf report said 2-3ft but the waves are flat!” or “The report says 5-7ft tomorrow, is it going to be huge?” The predicted surf height is arguably the least useful piece of information on the surf report. You should be paying more attention to the swell period!
If you look at a surf forecast you’ll generally see three bits of information:
- Swell size
- Swell period
- Swell direction
All are important. Most people just focus on the predicted swell size, but swell period actually has as much or even more to do with swell size in deciding how big the waves will actually be once they break at your surf spot.
Here’s an example of a surf forecast from Surfline showing three swells. On the left side, you can see the wave size forecast. This column tells you that Surfline predicts that the waves will be 3-4 feet at this specific beach.
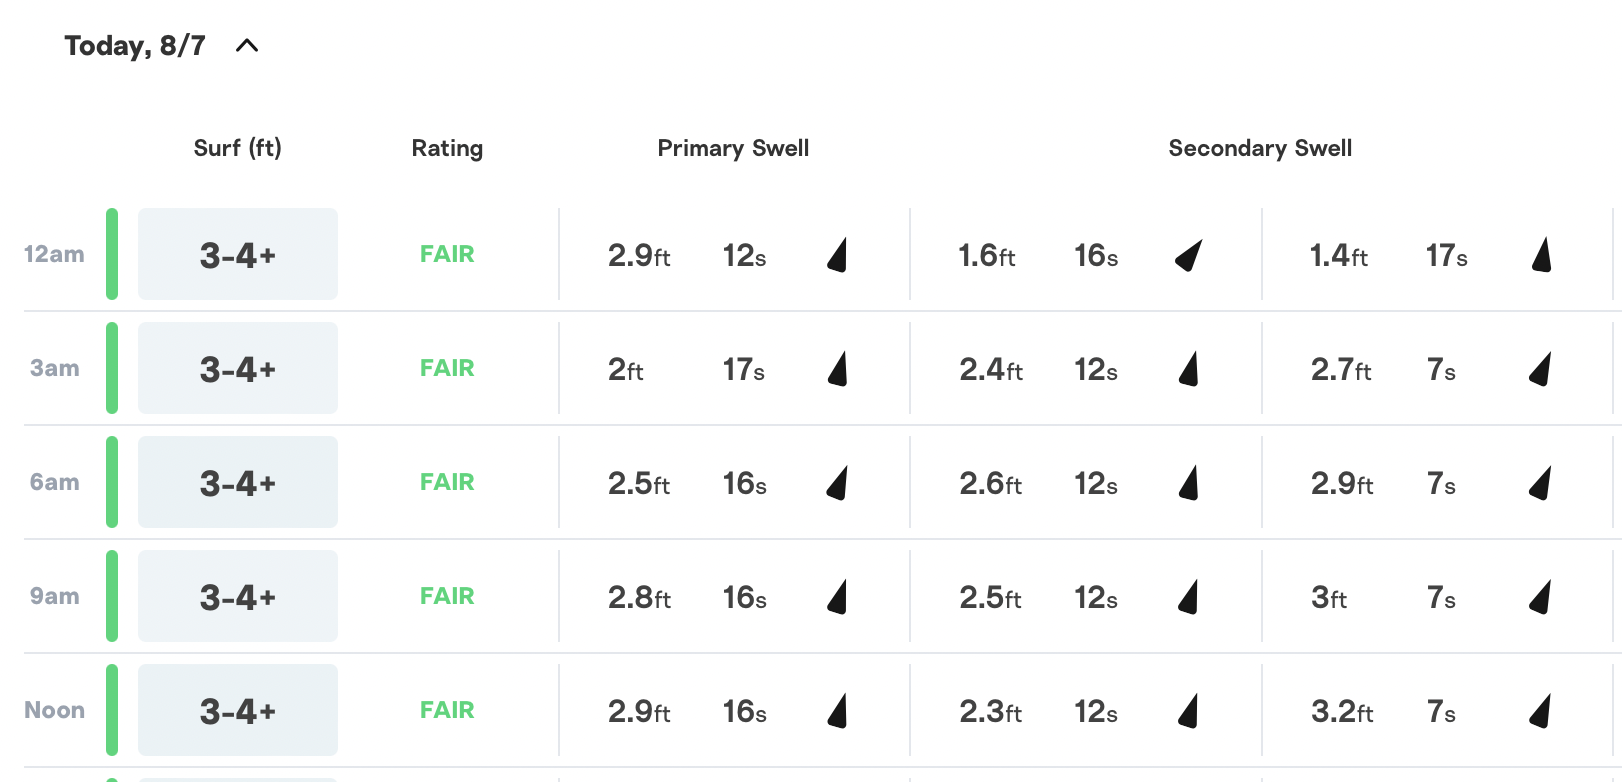
The next three columns (after the rating) show three different swells in the water. These are heights for the open ocean swells, not the size of the actual breaking waves. The first swell is 2.5ft at 16 seconds The second swell is 2.6ft at 12 seconds, and a third swell that at 6am is predicted to be 2.9ft at 7 seconds. The forecast predicts that the combination of these three swells will lead to waves in the 3-4ft range.
When I look at a surf forecast, I don’t even use that first column showing wave heights other than just as a guide that shows a trend – for example – are the waves predicted to be bigger today than yesterday? To me, the specific size predicted is relatively meaningless. You’ll know if you have ever looked at a surf forecast and then gone to your beach to check the surf, that the wave size predicted can be drastically off from reality.
The forecast given is usually for a general area or even a specific surf spot, but from the beach you’ll see that there may be 1′ waves breaking inside the cove of a point break, and 5′ waves breaking on the very outside even if the forecast says 3-4′. At a beach break, one end of the beach may be twice the size of the other side.
INTERESTED IN WATCHING SURF TUTORIALS? CLICK HERE.
SO HOW IS THIS INFORMATION GENERATED?
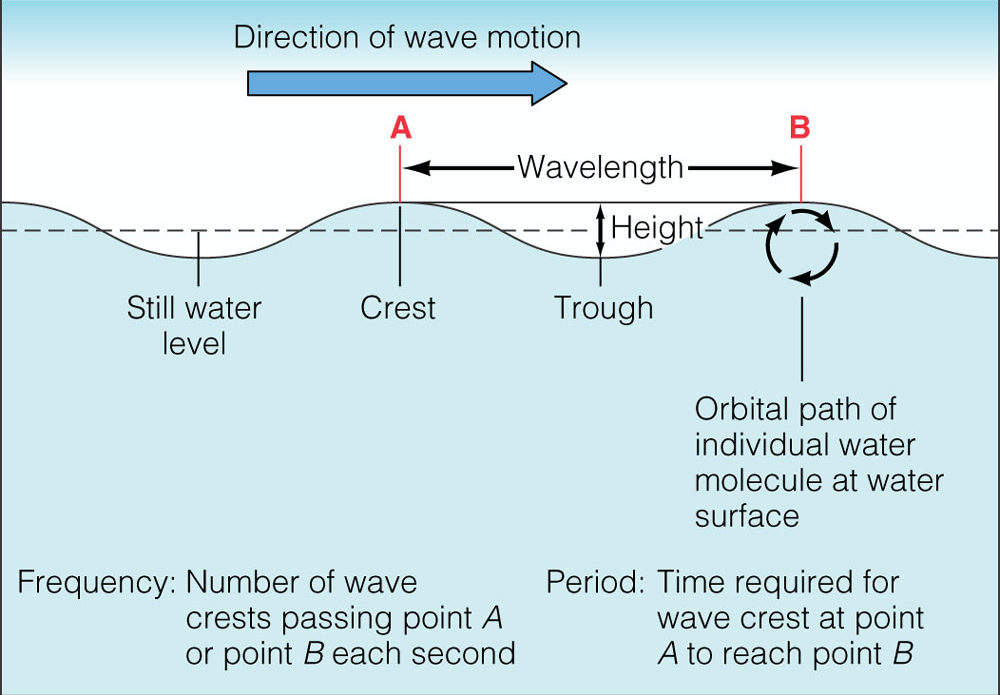
Swell forecasts use buoy readings which are then plugged into a computer model to predict readings in the future, usually at maximum up to 10 or 12 days out. A buoy is out there on the ocean measuring the rate and the distance that it is moved up and down by swells. It measures the height of the swell bump (crest) and the distance in time (wavelength) between crests. Since surf forecasts are predictions, they are most accurate within only a couple of days. Forecasts more than 5 days out should be taken with a grain of salt, as a lot can happen to change swells in that time, resulting in smaller or larger surf than first predicted.
HOW ARE WAVES CREATED?
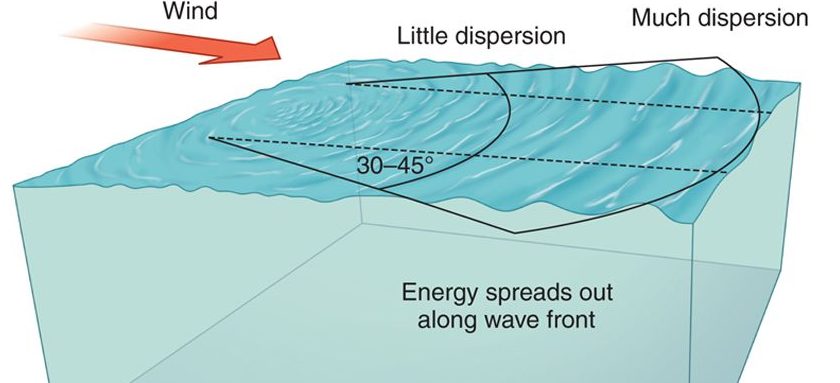
Waves are formed by wind blowing over the surface of the ocean. The further away the storm begins makes a difference. A weak storm far away may dissipate before it creates a very large swell. But if there is a big strong storm originating on the opposite side of the globe, that maintains its strength and high wind speed at it travels, it will transfer a large amount of wind energy into the ocean which creates a long period swell.
If you’re looking at a surf forecast, by “long period” swell we’re usually talking 14” and above. However, where you live plays a factor in what is considered “long period”. In southern California, swells of 16″ or 17″ typically count as “long”. On the east coast or in the caribbean, an 11″ or 12″ period counts as “long” due to the fact that the average period tends to be smaller.
These long period swells contain energy created by wind that gets pushed down into the ocean, which means the swells typically move further below the surface and are more affected by bottom contour but less by winds and swells from other storms. This is why long period swells can maintain their energy over a further distance.
How DO waves travel?
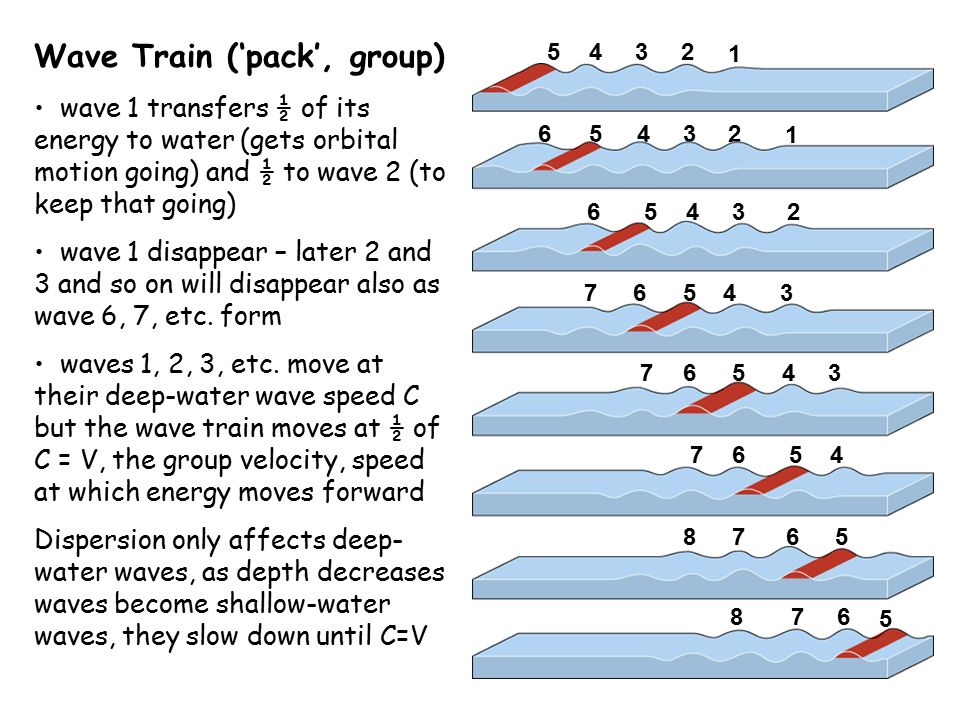 Swells travel as a group of waves or “wave train”. As the swell moves forward, the wave in the front of the wave train will slow down and drop back to the rear of the group while the other waves move forward by one position. Then the next wave in front moves back and another takes its place — much like a rotating conveyor belt that is also moving forward. It’s a process somewhat similar to the “drafting” technique used by bicycle racers, and it enables wave trains to conserve their energy as they travel great distances across the oceans, working together to sustain energy.
SO, WHAT ELSE AFFECTS THE SIZE OF WAVES?
Bottom contour plays a big role in affecting the size of the waves from any swell, and wave height forecasts don’t always take that into account. For that reason, it’s much more useful to understand how to read the swell prediction from the buoy numbers, then after developing familiarity with your local beach you can better predict the actual size of the waves you will encounter that day from looking at the numbers. That’s what we’ll attempt to explain below. Bear with me, there’s some science and math involved!
If you’re a math geek or like numbers keep reading. Otherwise, skip down to “shoaling”…
You can calculate the speed of the waves with this formula: The speed of a swell or “wave train” is 1.5 x period. So looking at our example forecast above the 13” swell will have a speed of 1.5 x 13 or about 19.5 knots and the 22” swell will be 1.5 x 22 = 33 knots. If you want to convert that to mph (because who understand knots anyways?) the conversion is 1 knot = 1.2 mph. A 13” swell moves at 23.4 mph and a 22” swell moves at 39.6 mph. So a 22” period swell is moving at double the speed of a 13” swell. Individual waves move even faster. This is the speed of the wave train. If you want to calculate the speed of an individual wave, it is swell period x 3. So an individual wave in a 13” swell is going to be traveling at 13 x 3 = 39 knots or 46.8 mph vs a 22” period wave traveling at 22 x 3 = 66 x 1.2 = 79.2 mph.
Again, think of the wave train like a rotating conveyor belt that is also moving forward. This is the speed the wave travels through open water, not the speed that the wave will be traveling when you’re sitting in the water waiting to catch it. As the wave train moves into shallower water or encounters a rock shelf, headland, or beach the speed will slow down.
DeptH:
Waves begin to feel the ocean floor at a depth of 1/2 the wave length. To figure it out you take the number of seconds between swells, square it, then multiply by 2.56. The result will equal the depth the waves begin to feel the ocean floor.
So a 13” swell = 13 x 13 = 169 x 2.56 = 432’
But a 22” swell = 22 x 22 = 484 x 2.56 = 1,239’ deep
So longer period swells are more affected by bottom contour and that’s why they are called ground swells (typically over 13” long). We call shorter period swells wind swells because they are always generated by local winds (even though all waves are actually generated by wind), and usually can’t travel more than a few hundred miles before they decay.
Shoaling:
When waves approach shallower water their lower reaches begin to drag across the ocean floor and that friction slows them down. The wave energy below the surface of the ocean is pushed upward causing the waves to increase in height. The longer the period, the more energy under the surface, which is why longer period waves grow bigger than short period waves.
A 3’ wave with a 10″ period may only grow to be a 4’ breaking wave but a 3’ wave with 20 seconds may grow to be a 15’ breaking wave – more than 5 times the deep water height depending on the contours of the ocean floor.
As the waves pass into shallower water they become steeper and unstable as more and more energy is pushed upwards, finally to a point where they break at typically a depth of 1.3 times the wave height. So a 6’ wave will break in about 8’ of water.
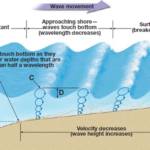
A gradually sloping bottom will create a crumbly slow-breaking wave while a wave traveling over a steep ocean floor or hitting a reef result in faster hollower breaking waves. As the waves move into shallower water the speed and wavelength decrease (the waves get slower and closer together). So it isn’t that looking at a swell that is 20” means that the waves will come 20” apart. It’s a more complicated formula affected by so many factors.
Wrapping:
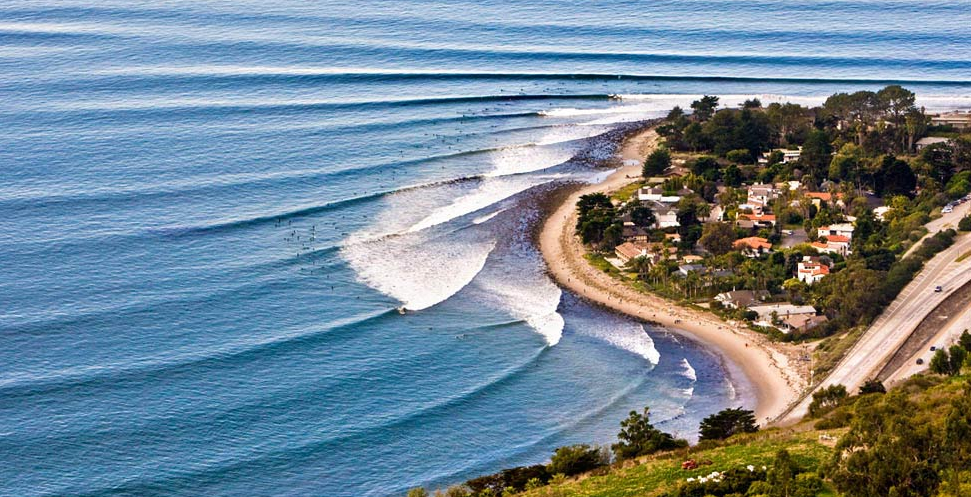
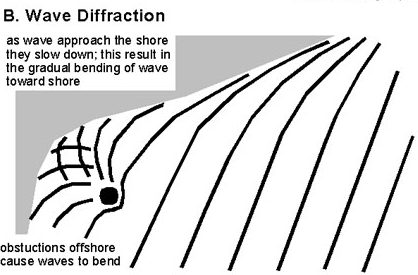
So from everything we’ve discussed above, you should have an idea of why and how this wrapping happens. The wave train approaches the coast, as it starts to “feel” the bottom it slows down and starts to break. The swell energy that has not yet felt the bottom continues traveling forward but the friction causes it to bend a bit and the lines wrap inwards, creating a very long “perfect” wave for surfers to enjoy.
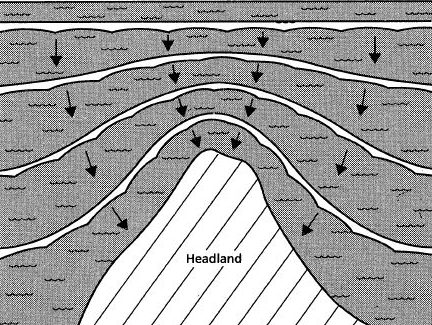
This wrapping effect is most visible on a point break, but it can happen whenever an obstacle is encountered,whether it is a sandbar, reef, river mouth, bay, or even man made object such as a pier or jetty. If you are looking for waves with better shape, look for a coastline with some feature that will help the swell to wrap. If you have a long straight beach break without anything to break it up you will most likely have long closed-out waves.
In Summary
Swell forecasts tell you a lot more than just what size waves they are predicting for any particular beach, and that other information – including swell height and period can actually be more useful in helping you to predict the size of the waves breaking that day at your local break.
The best way to start understanding surf forecasts is to look at the forecast, then go to your beach to check the wave size. Notice the difference in predicted size vs. the size of the waves you actually see breaking. Then the next day, do the same thing. And the day after that…. Over time you’ll start to see a pattern and figure out which combination of numbers creates the ideal situation for the type of waves YOU like to ride. Then you’ll know which days to call in sick and score!
Special thanks to Surfline.com for assistance with the mathematical formulas quoted above.